OMOP Variant Occurrence
Summary
The _variant_occurrence table is a custom extension to the OMOP Common Data Model (CDM) that captures detailed genetic variant information identified in patients through genomic testing. This table enables precision oncology research by providing granular variant-level data including genomic coordinates, variant types, molecular consequences, and clinical interpretations.
Currently, the table contains variants identified via the Stanford Actionable Mutation Panel for Solid Tumors (STAMP) test, sourced from the Epic Genomics Suite. STAMP tests processed through Epic Genomics Suite starting in August 2025 are included in this table.
Each record in the _variant_occurrence table includes:
- Genomic information (chromosome, position, DNA/amino acid changes)
- Variant classification (type, molecular consequence)
- Clinical interpretation and assessment (tier classification)
- Test metadata (test name, specimen information)
- Linkage to clinical context (visit, procedure, provider)
As of February 2026, this table includes 479 patients with 3,731 genetic variants.
Key Considerations
Only simple variants detected in STAMP tests are present in the source data; fusion variants and copy number variants are not currently reported. We expect that additional variant types will be incorporated in future releases as the dataset continues to evolve.
The OMOP variant occurrence table does not currently contain Foundation One tests or certain types of variants detected by STAMP (both of which were previously present in the Philips data). We expect that additional STAMP-detected variant types will be available later this year.
📊 Data Volume
- Patient Count: 479
- Ordered Tests Count: 493
- Variant Count: 3,731
🧬 Data Components
- Unique Genes: 195
- Molecular Consequences: 3
Variant Occurrence Metrics
This section presents key metrics and visualizations of genetic variants identified in our patient population through STAMP genomic testing. The following table shows the distribution of patients with variant data across key clinical cohorts:
Note: Tumor board patients are identified by visit records containing “tumor board” (case-insensitive). Thoracic cancer patients are identified from NeuralFrame diagnoses with primary sites including lung, bronchus, or thymus.
Genomic Testing Timeline
The following visualization shows the monthly trend of genomic test orders over time with cumulative totals.
Note: Each unique procedure_occurrence_id represents a distinct genomic test order. A single test may detect multiple variants in a patient.
Variant Characteristics
The following visualization shows the most frequently mutated genes in the cohort.
Note: Percentages shown represent the proportion of patients with variants in each gene.
Key Consequence Types:
- Missense: Amino acid change
- Nonsense: Premature stop codon
- Frameshift: Reading frame disruption
- Splice site: Affects RNA splicing
Distribution of variants by phenotype-specific variant classification.
Clinical Significance:
- Pathogenic/Likely Pathogenic: Variants with established or strong evidence for disease association and potential therapeutic implications
- Benign/Likely Benign: Variants with no expected clinical impact
- VUS (Variant of Uncertain Significance): Variants requiring further investigation to determine clinical relevance
- Other classifications: May include context-dependent or conditional pathogenicity assessments
Specimen Type and Specimen Source
Distribution of variants by specimen type.
Common Specimen Types:
- Tissue: Solid tumor biopsies
- Blood: Liquid biopsies, circulating tumor DNA
- Other sources: Bone marrow, fluid samples
Distribution of variants by specimen anatomic source.
Allelic Frequency Distribution
Distribution of allelic frequencies across different variant molecular consequences.
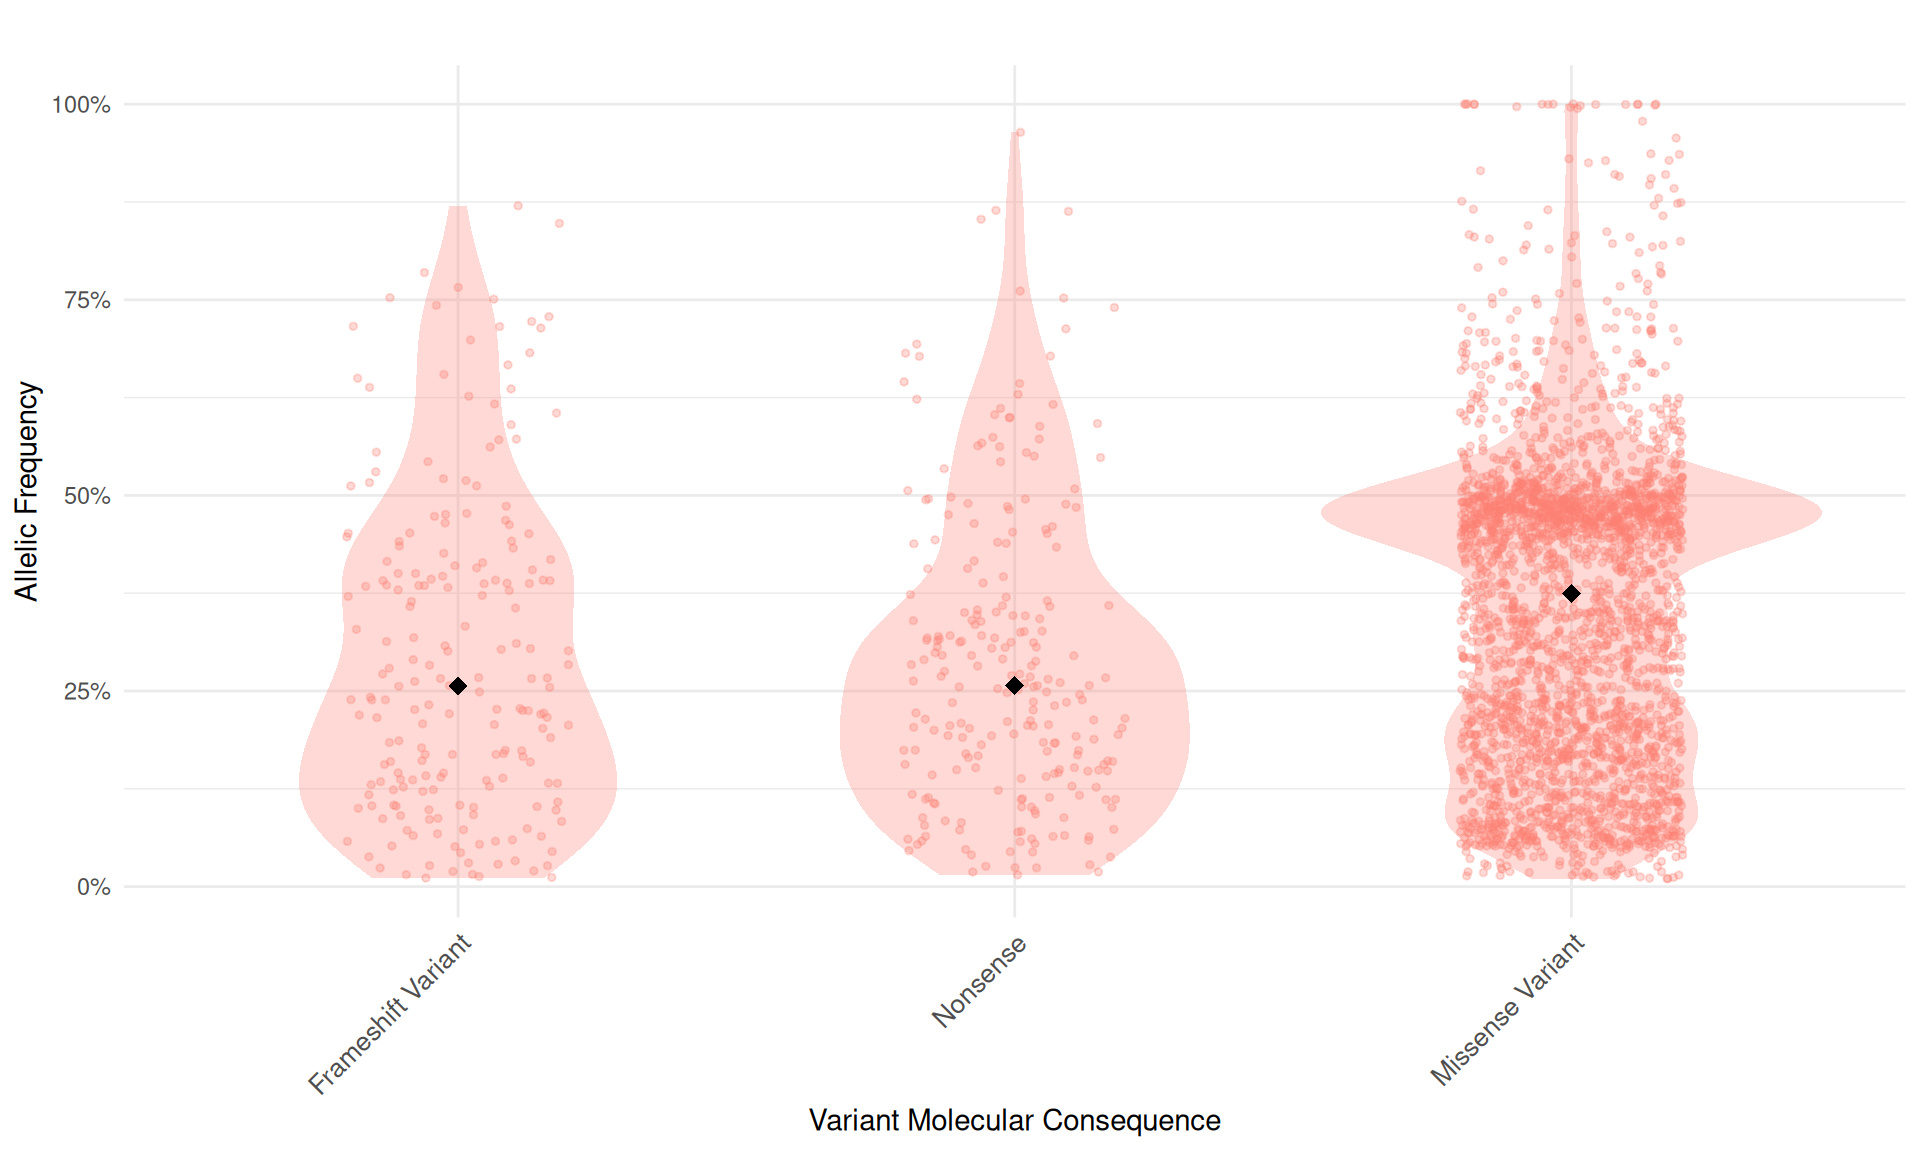
Interpretation: Each point represents a variant’s allelic frequency. The diamond markers indicate the median allelic frequency for each consequence type. Allelic frequency represents the proportion of DNA reads containing the variant allele.
Mutation landscape showing allelic frequency distribution across the most frequently mutated genes.
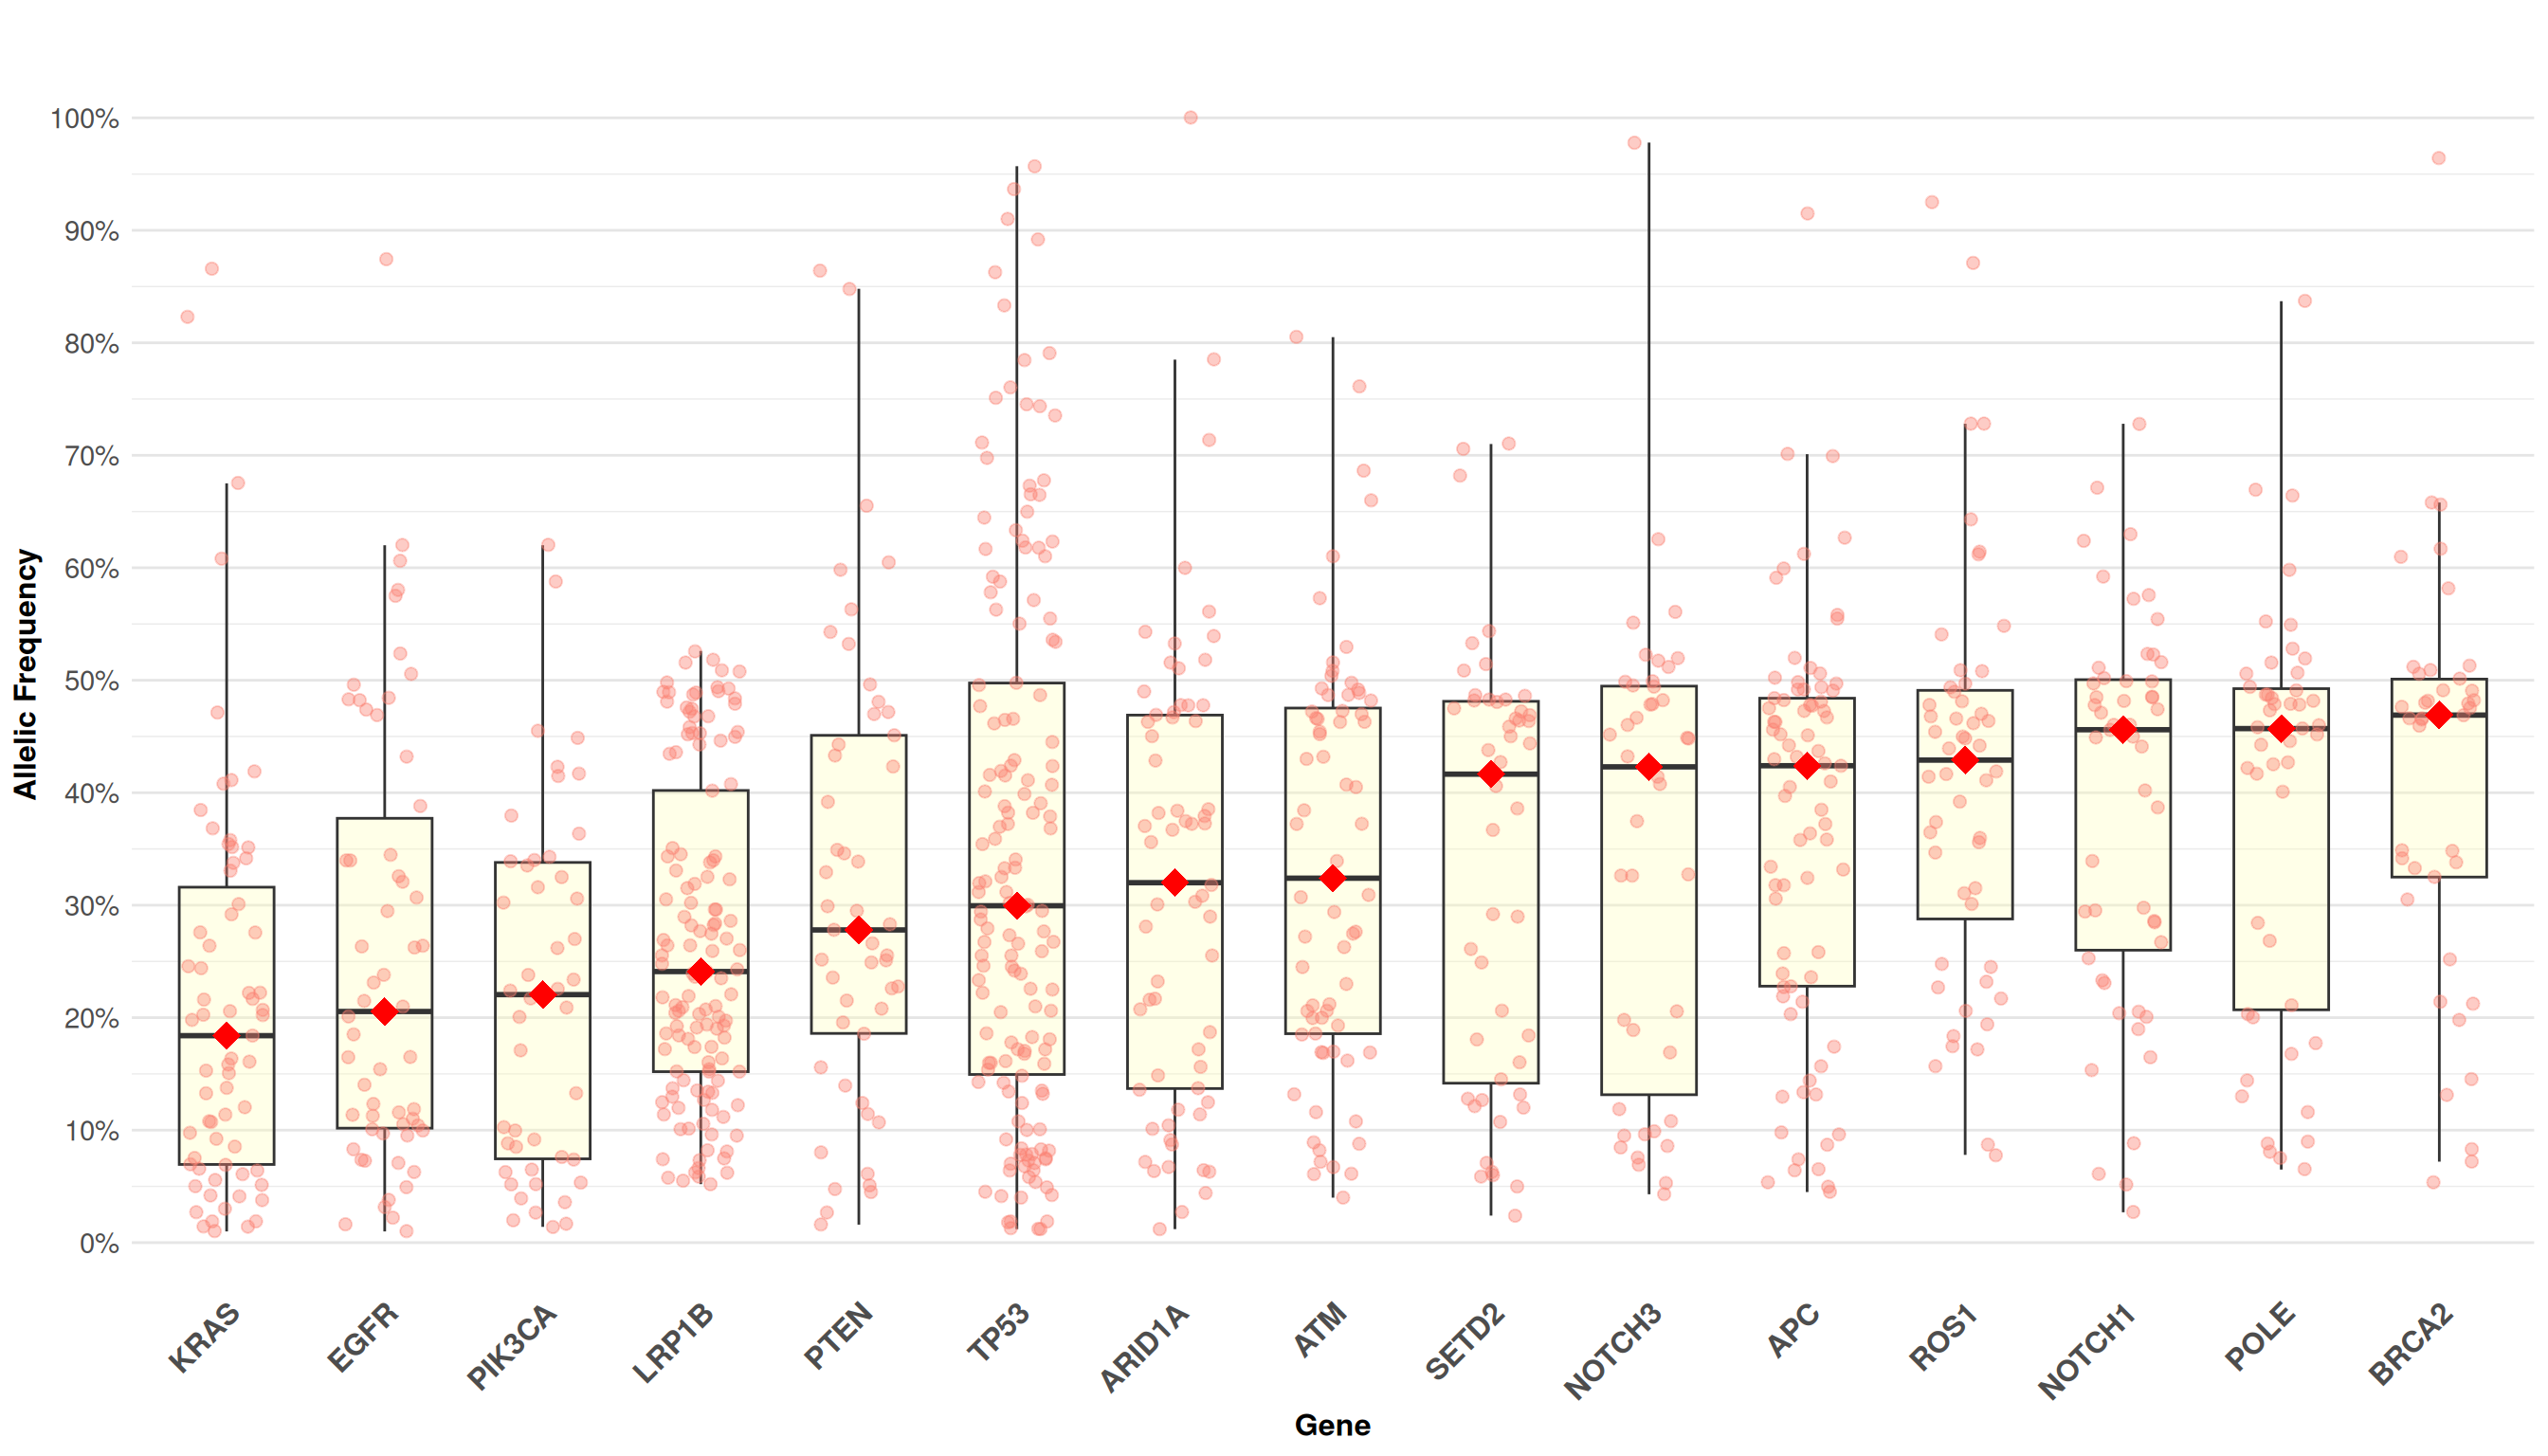
Interpretation: Each point represents a variant in a specific gene. Box plots show the distribution (median, quartiles, and range) of allelic frequencies for the top 15 most frequently mutated genes. Red diamond markers highlight the median allelic frequency per gene. Genes are ordered by median allelic frequency.
Thoracic Tumor Board Patient
This section focuses on the 45 patients with both thoracic cancer diagnoses and tumor board presentations who have genomic variant data. These patients represent a high-complexity cohort requiring multidisciplinary care.
Top genes mutated in thoracic tumor board patients.
Note: Percentages represent the proportion of the 45 thoracic tumor board patients with variants in each gene.
Distribution of variant clinical significance in this cohort.
Types of specimens collected from thoracic tumor board patients.
Summary: This cohort of 45 patients represents the intersection of thoracic cancer complexity and multidisciplinary tumor board evaluation, with genomic profiling informing treatment decisions.
Source Code
The source code for this page can be found here, and the SQL queries that support these metrics can be found here.